If an award-winning Software-as-a-Service (SaaS) product falls in the woods but nobody’s around to hear it, did it even make a sound? This is one of the very famous SaaS riddles which implies that even if you have built a great product but no one is engaging with it, it isn’t a successful product. In this blog, we’ll talk about one of the most important metrics to measure product success: Product Stickiness Ratio
What is the Product Stickiness ratio?
Product Stickiness Ratio is the ratio of (Daily Active Users) DAU and (Monthly Active Users) MAU. It is one of the widely used metrics for product engagement and tells us how sticky a product is. It was popularised by Facebook and was used by it to understand the true stickiness of the Facebook app.
Let’s go deeper and breakdown this metric:
- Daily Active Users (DAU): DAU is calculated as the total number of unique users who use your product on any given day. In other words, DAU is the total count of users who use your product at least once in a day.
- Monthly Active Users (MAU): MAU is calculated as the total number of unique users who use your product in a month. In other words, MAU is the total count of users who use your product at least once in a month.
For example, a DAU/MAU ratio of 0.3 implies that 30% of the users who use the product at least once in a month also use it on a daily basis i.e at least once in a day.
Before we proceed let’s be clear with the definition of an “active user”. An active user can be anyone who logs into the product, completes a task, adds a team member etc. The definition varies with the type of business. Businesses should choose this metric on the basis of their user engagement goals. Businesses should consider completion of the most important step in every session for a user to be considered as an active user.
According to SaaS consultant Lincoln Murphy, the definition of “active” should build upon the value that you’re delivering to your customers -which is why it’s important to understand why your customers use your app and what they’re looking to achieve. For example, Facebook defines a user as an active user if the user has interacted with the site by liking, sharing, commenting or messaging on the platform. Similarly for Twitter, an active user is defined as a user who is following at least 30 accounts and is followed by at least one-third of those accounts.
Why is measuring DAU/MAU ratio better than measuring DAUs and MAUs alone?
DAUs and MAUs are standalone absolute numbers which can’t be compared for various businesses because the definition of active users varies for different companies. However, DAU/MAU is a holistic metric that speaks about product success. Since it is a percentage, it can be compared for various companies as well to understand their success in reaching their user engagement goals.
We have understood what Product Stickiness Ratio is, now let’s try to understand how this metric is beneficial for a product company:
Here is how various teams can use Product Stickiness Ratio to get better results.
Product Team:
- To decide whether you can focus on building a new product or your existing product requires improvement.
- To understand the product adoption amongst the target users and hence improve the product road map.
Marketing Team:
- To segment the users on the basis of DAU/MAU ratio and increase usage of for the segment with low DAU/MAU ratio through strategies such as push notifications, educational email campaigns etc.
- To create a lookalike audience of the segment with high DAU/MAU ratio since this segment has the least likelihood of churn.
Retention Team:
- To pitch plan upgrades to customers by segmenting them on the basis of DAU/MAU ratio.
- To create a retention plan for customers with low DAU/MAU ratio since customers with low average DAU/MAU ratio have higher likelihood of churn.
How does DAU/MAU vary with different stages of the Product Life Cycle?
In the early stages, businesses usually focus on acquisition rather than retention. Hence, new users are a significant percentage of DAU and MAU. However, as the product moves ahead in the lifecycle and approaches the mature stage, repeat users constitute a significant portion of DAU and MAU. This happens because at the mature stage the market is already saturated and so, CAC shoots up. Therefore, retention becomes a priority over acquisition.
Due to this reason, DAU/MAU may be low at the early stages and may have a higher value in the growth and mature stages of the Product Lifecycle.
Does a low DAU/MAU ratio necessarily signify an unsuccessful product?
The answer is NO. There are a lot of products that aren’t daily in nature and hence we might not require to use it on a daily basis. Let’s understand this with some examples:
- You may not use banking apps on a daily basis because you do not need to transfer money on a daily basis. So, such apps would have low DAU/MAU ratio.
- For that matter, the apps for planning trips and booking tickets such as AirBnB, Make My Trip etc are not used daily because on an average people make 2 to 3 trips per year. So, the DAU/MAU tends to 0 for such apps. However, this number should not signify that such apps fail to achieve their user engagement goals.
- Many SaaS products such as Kissflow may not be used on a daily basis. Such tools are used twice per user per week on an average.
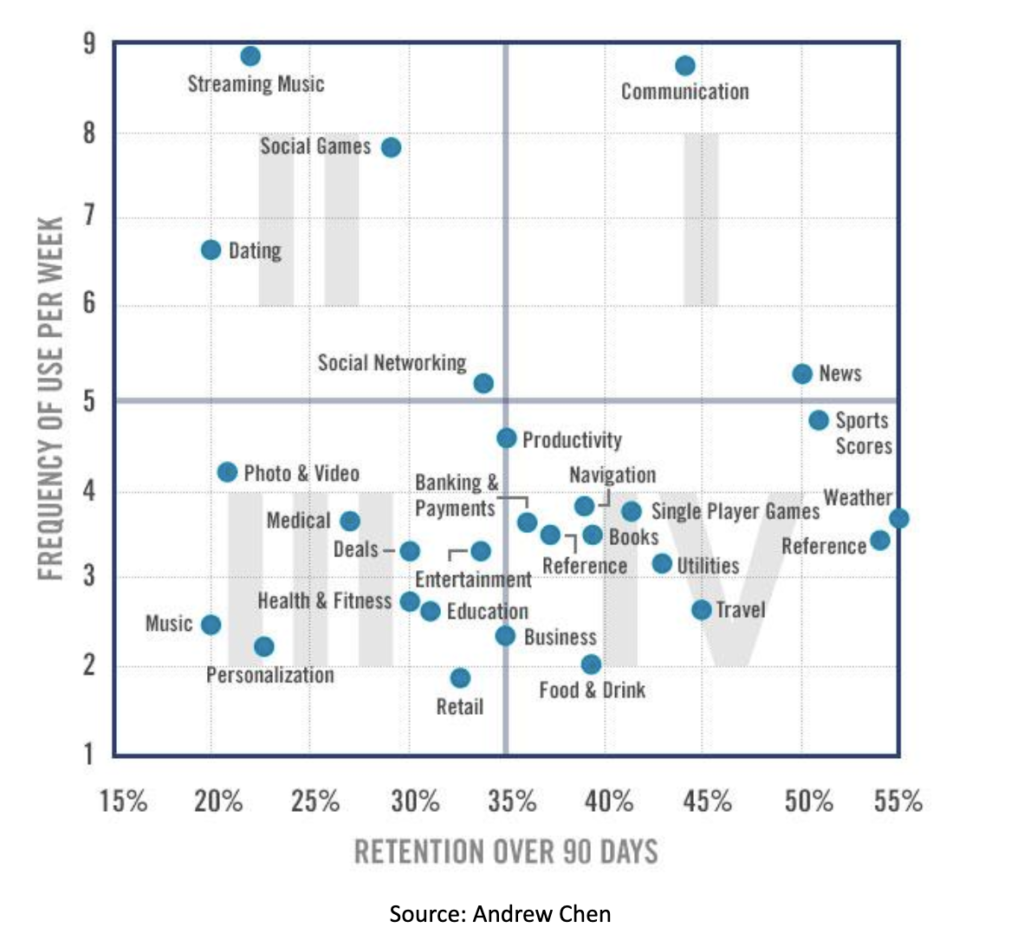
Below is the diagram that shows the loyalty that every category of app enjoys:

Source: Andrew Chen
As we can see from the graph above, communication apps are both high frequency and high retention. That’s obvious, for we all know how inevitable apps like WhatsApp have become for us.
On the other hand, we can see that app categories such as weather and sports scores app have medium frequency per week but high retention over 90 days. One does not need to check weather or sports scores on a daily basis, therefore the frequency is relatively lower.
It is also worth noticing that for some categories such as communication apps and social networking apps, the value to the user increases as the number of active users increase on the platform. This is what we call Network Effects.
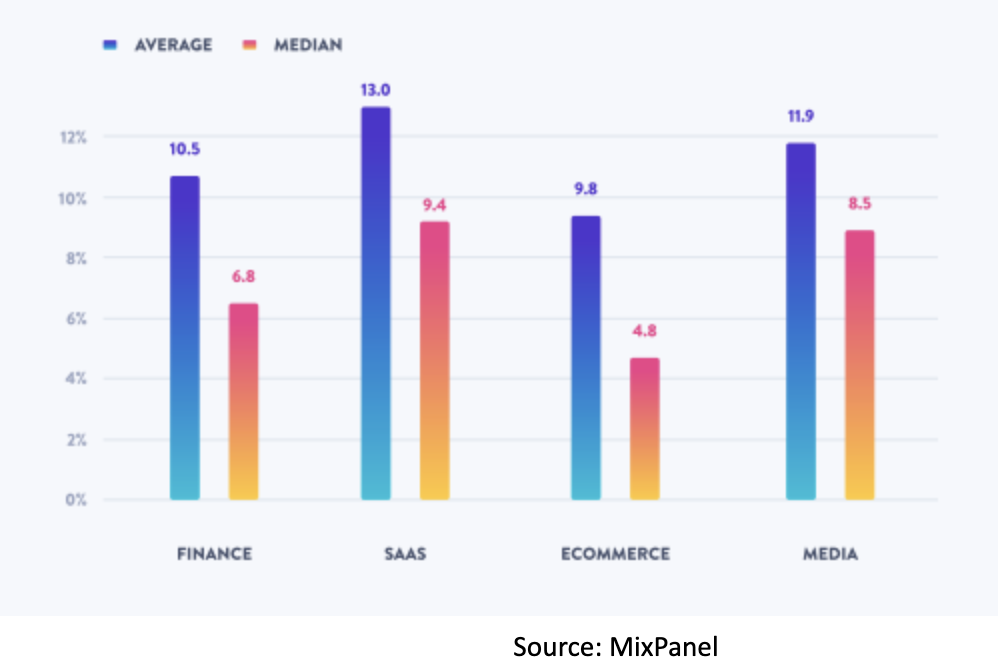
Let’s now look at the average product stickiness by industry

Source:MixPanel
The benchmarks above show the average stickiness of products for various industries. It is calculated as (DAU/MAU)*100. The chart also mentions the median along with the average because medians are less likely to be skewed by outliers. For the SaaS industry, the average stickiness is 13% which means slightly less than 4 days of activity/month/user. The Median for the SaaS industry is 9.4%, implying less than 3 days of activity/per user per month.
The report also mentions the median Product Stickiness Ratio for the top performers in each of these sectors.

Source:MixPanel
The top performer in the SaaS industry has the Median Stickiness of 28.7% i.e using the product for 8.61 days in a month. The top performers in Finance, E-Commerce and Media industry have median stickiness ratio of 24.5%, 22.1% and 26.1% respectively. On an average, across industries, 20% stickiness is considered good and 25% and beyond is considered exceptional.
While Product Stickiness Ratio is a very good metric to understand your Product Health, there are certain things to be cautious about. Here are a few cons of this metric:
- Some percentage of your daily users every day would be new users who may never come back. So, it may end up inflating MAU in comparison to average DAUs which may lead to a lower than expected Product Stickiness Ratio.
- Another major downside of this metric is that it does not help you understand what users are churning and the ones that are retained. To solve this, Cohort Analysis comes handy.
- If your app is not a high-frequency usage app per user, DAU, MAU or DAU/MAU may not give you a true picture of your product success. For such apps, metics like Customer Lifetime Value, monthly churn and retention rates etc are more useful for determining the product success.
Summary
- Product Stickiness Ratio is a very important metric for all teams in a product company especially Marketing, Retention and the Product teams.
- DAU/MAU is a better metric for measuring Product Success as opposed to DAU or MAU alone.
- A low DAU/MAU ratio does not necessarily signify bad product health.


